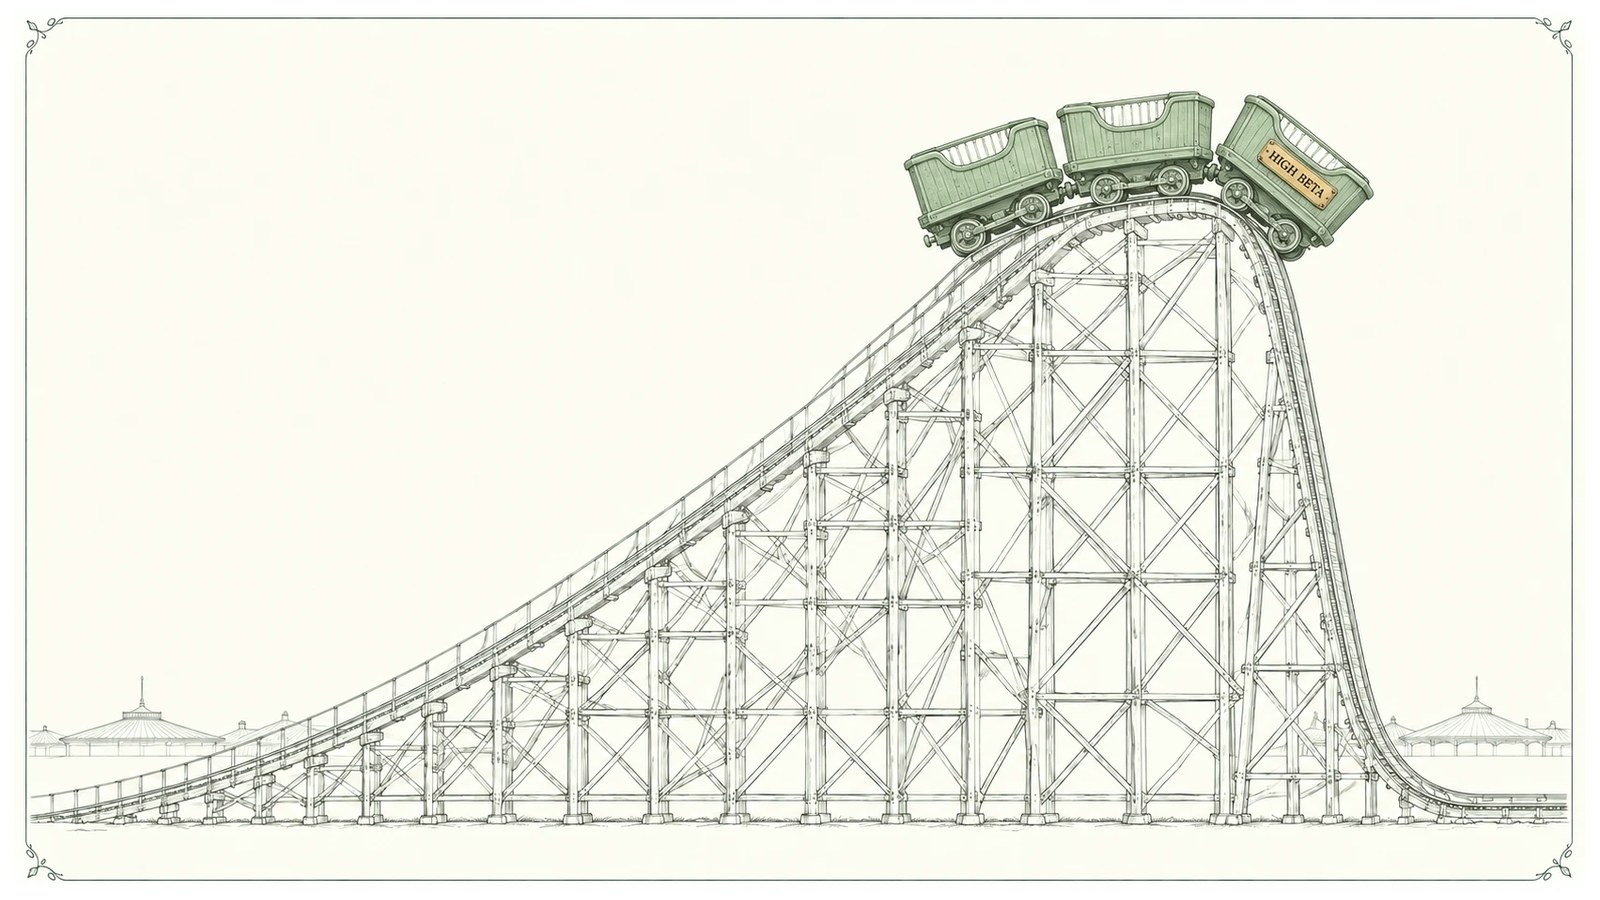
More than a quarter of the S&P 500 is now moving against the market. A recent paper by Kailash Concepts found that a record 27% of the index’s stocks have a negative six-month beta. From 1989 through 2023, that share averaged less than 1%. The previous high, 17%, was set in early 2001 as the tech bubble burst.
Of all the extremes in today’s market, this is one of the most troubling. Beta measures how much a stock moves with the market: a reading of 1 means in step, and a negative reading means the opposite way. The typical stock no longer tracks the index. The median beta is 0.42, against a long-term reading of 0.97.
The market has split in two
Below the surface, stocks in the lowest-beta quintile of the S&P 500 now move against the market, and the group’s beta is -0.51. The highest-beta quintile moves about twice as much as the index. The beta gap between the highest- and lowest-beta quintiles is 2.6, the widest on record and nearly three times its level at the March 2000 market peak.
Sky-high hopes, near-record prices
The high-beta group also carries historic expectations. Analysts expect high-beta stocks to grow earnings by 35% a year, more than double the group’s long-run median forecast of 15.4%. In the past, such high expectations led to negative returns for high-beta shares. Investors are paying about 7 times sales for these companies, just below the most expensive level in history. That premium is a sharp break from longer-term norms. From 2010 through 2022, high-beta stocks traded at or below the valuation of low-beta stocks about half the time.
History favors the calmer stocks
The last extreme of this kind, the dot-com bubble, ended badly for high beta. In the five years after August 2000, high-beta stocks lost 50%, while low-beta stocks gained 21%.
The beta gap between the highest- and lowest-beta quintiles is 2.6, the widest on record and nearly three times its level at the March 2000 market peak.
Analysts expect high-beta stocks to grow earnings by 35% a year, more than double the group’s long-run median forecast of 15.4%.
The pattern is not limited to bubbles. Academic researchers have documented the “low-beta anomaly”: over time, less volatile stocks have outperformed high-beta stocks. This is attributed to the superior quality, dividend and valuation characteristics of lower-beta companies.
The turn may have started
The gap between high and low beta opened only in the past year and a half. Two funds show it. The Invesco S&P 500 High Beta ETF (SPHB) holds the S&P 500’s highest-beta stocks. The AGF U.S. Market Neutral Anti-Beta ETF (BTAL) does the reverse: it buys low-beta stocks and bets against high-beta stocks.
Until about May 2025, the two traded in line with each other. Then the AI-driven rally accelerated, and high beta pulled far ahead. By its October 6 peak, the high-beta fund was up 78% from May 2025.
Over the past month, that trend has reversed: high-beta stocks fell 13% and the anti-beta fund rose about 10%. Even so, as of November 10, 2026, high-beta stocks remain up 52% since May 2025, while the anti-beta fund is still down 31%.
One way to position for it
One of the most powerful mean-reversion dynamics in the market may have begun, as the gap between high-beta and low-beta performance narrows. A strategy such as the AGF U.S. Market Neutral Anti-Beta ETF (BTAL) could be an effective way to shift away from high-beta exposure and gain from a broad rotation into less volatile, higher-quality companies.
How Flextion rates BTAL
Flextion rating as of November 11, 2026. A rating is our view of how a fund will do against its benchmark over the next 12 months.
Views are the author’s as of November 11, 2026 and are not investment advice.