The 10 Million Barrel Mystery: Why Energy Could Be This Decade’s Most Contrarian Bet
Physics, geology, and record bearish sentiment point to a sector poised for a multi-year run
When the Numbers Don’t Add Up
A 17-year bear market. Record short positions. The most hated sector in global markets. And yet, the fundamentals tell a very different story.
The International Energy Agency (IEA) is forecasting the largest oil surplus on record for 2026, roughly 3 million barrels a day. Hedge funds are record short. Energy ETF assets are down 30% in a year.
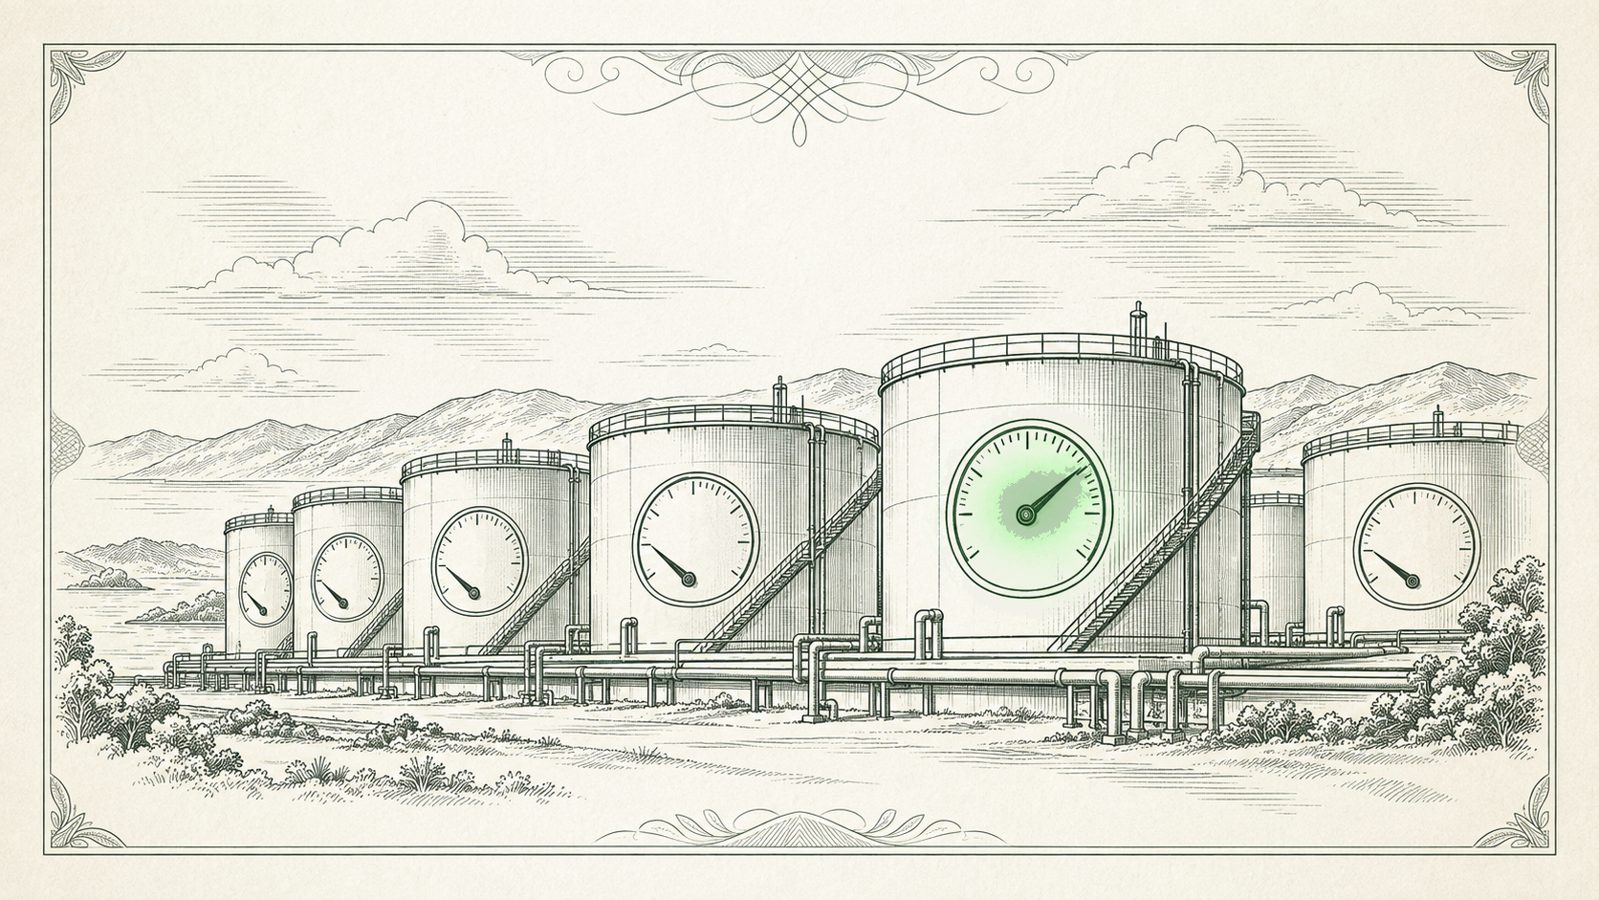
But here’s the puzzle: if the world is overproducing by millions of barrels a day, why have global crude inventories fallen by 10 million barrels this year?
The math doesn’t work. And when consensus is this confident and this wrong, contrarians take notice.
The International Energy Agency (IEA) is forecasting the largest oil surplus on record for 2026, roughly 3 million barrels a day.
Oil last peaked at $145 in 2008.
At the same time, 2.5 billion people are entering the high-consumption phase of the income S-curve, five times more than in prior decades.
The Demand Story Everyone Missed
Oil last peaked at $145 in 2008. The S&P Energy sector once made up 11% of the index; today it’s under 3%. An entire generation of investors have been conditioned to treat energy as a stranded asset, a value trap to avoid. Yet even through recessions, pandemics, and net-zero hype, oil has held near $60 a barrel, double the panic levels of 2015 and 2020. Something beneath the surface is supporting prices that the prevailing narrative isn’t capturing.
Positioning tells the rest of the story. “Managed money” traders now hold record-short Brent positions. When positioning gets this extreme, reversals tend to be fast and violent. The popular “peak demand” thesis rests on faith in electric vehicles. But physics and demographics are refusing to cooperate.
Outside China, EV sales are plateauing while hybrids surge. Why? Oil still stores 100 times more energy per pound than batteries. Even with aggressive adoption, there could still be two billion oil-powered vehicles on the road by 2050, up from 1.3 billion today. Transportation demand isn’t collapsing; it’s evolving.
At the same time, 2.5 billion people are entering the high-consumption phase of the income S-curve, five times more than in prior decades. They’re buying cars, appliances, air conditioners, and plane tickets for the first time. That’s a 20-year tailwind few models account for. Add AI to the mix: data-center electricity demand is exploding, driving up power costs and pulling more fossil fuel capacity back into the grid. No one is modeling “AI-driven oil demand,” but it’s already happening.
Supply Is Running on Fumes
If demand surprises to the upside, supply may surprise even more on the downside.
Seventy-eight percent of oil executives report delayed or curtailed projects. Global capital spending remains one-third below 2015 levels. U.S. shale production could peak as soon as next year. Spare capacity sits around 3% of global production — a historical low that leaves no buffer for geopolitical shocks. China has been stockpiling strategic reserves while the U.S. SPR is at a 40-year low.
We’ve seen this before. In 2002, the IEA predicted a surplus. By 2008, prices had soared from $34 to $145 as demand quietly outpaced supply. The setup today is eerily familiar, except sentiment is even worse.
Meanwhile, inflation and monetary easing favor real assets. Across five decades, whenever inflation averaged above 3% and was rising, energy delivered the best real returns of any sector. With 26 central banks cutting rates and reflation policies accelerating, the cycle is turning back toward energy.
The Contrarian Setup
While gold, copper, and aluminum have already surged, energy has lagged badly, a divergence that rarely lasts. When oil rebounds from $60 to $90, energy equities don’t move in percentages — they move in multiples.
Valuations are at generational lows. Energy stocks trade at the lowest P/Es in the S&P 500 and sit in the bottom 20% of their 30-year range. After years of discipline, companies are returning more cash to shareholders than they’re spending on growth.
And sentiment? Maximum bearishness. Record shorts. Collapsing ETF flows. The smallest index weighting in decades. This is what bottoms look like.
At Flextion, we focus on inflection points where fundamentals, valuation, and sentiment collide to create asymmetric opportunity. Energy checks every box: severe underperformance, structural supply constraints, and a massive gap between narrative and reality. Energy may not be the trade everyone’s talking about. But it could be the one that defines the decade.
Views are the author’s as of November 19, 2025 and are not investment advice.