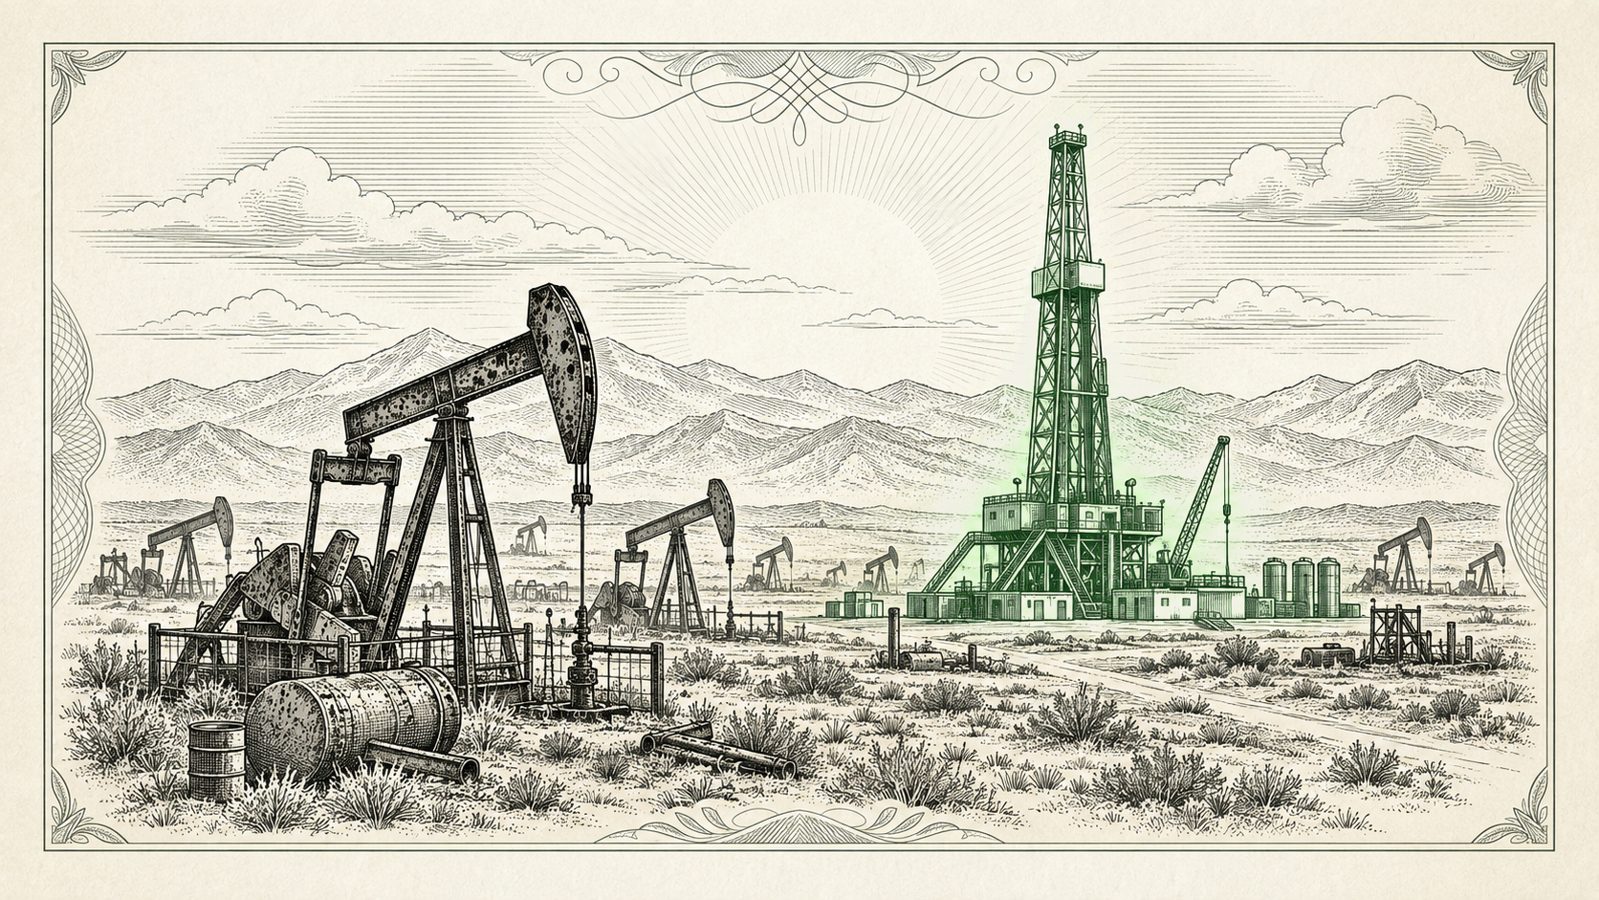
- Hedge funds are record short. Energy ETF assets have collapsed 30% in a year.
- Oil peaked at $145 in 2008, the S&P 500 Energy Sector made up 11% of the index in 2011. Today it’s barely 3%.
- Global spare capacity sits at just 3% of production, near record lows, while the US Strategic Petroleum Reserve is at a 40-year low.
When everyone agrees energy is finished, it’s time to pay attention.
The International Energy Agency is forecasting the largest oil supply surplus on record. Hedge funds are record short. Energy ETF assets have collapsed 30% in a year. And yet, despite all that, global crude inventories have fallen by 10 million barrels this year.
Energy ETF assets have collapsed 30% in a year.
Hedge funds are record short.
global crude inventories have fallen by 10 million barrels this year
If we’re supposedly drowning in oil, why is supply tightening?
The math doesn’t work. When consensus gets this confident and this wrong, that’s where opportunity hides.
The Peak Demand Myth
Seventeen years of underperformance have trained investors to ignore the sector entirely. Oil peaked at $145 in 2008, the S&P 500 Energy Sector made up 11% of the index in 2011. Today it’s barely 3%.
A whole generation has learned to see energy as dead money: a value trap, not a value play. That exhaustion is exactly what major reversals are made of. Markets bottom not on bad news, but on indifference.
Markets bottom not on bad news, but on indifference.
The bearish case assumes “peak demand” is imminent, driven by electric vehicle adoption. But outside China, EV sales are stalling while hybrid sales surge. The reason is simple: physics.
Oil stores energy 100 times more efficiently than batteries. Even with aggressive EV adoption, the world will likely have 2 billion oil-powered vehicles on the road by 2050, up from 1.3 billion today. Transportation demand isn’t vanishing, it’s evolving, being joined by a new and underestimated source of consumption: AI.
AI-driven data centers are creating massive new electricity loads, competing with EVs for grid power and driving fossil fuel use to fill the gap. Nobody is modeling “AI-driven oil demand,” but it’s already visible in the data.
On the supply side, the picture is even tighter.
Seventy-eight percent of oil executives report delayed or canceled projects. Capital spending is still one-third below 2015 levels. US shale could peak as early as next year. Global spare capacity sits at just 3% of production, near record lows, while the US Strategic Petroleum Reserve is at a 40-year low. There’s no cushion left in the system.
of oil executives report delayed or canceled projects
Capital spending is still one-third below 2015 levels.
Global spare capacity sits at just 3% of production
the US Strategic Petroleum Reserve is at a 40-year low
We’ve Seen This Movie Before
This setup isn’t new. In 2002, the IEA also forecast a major oil surplus. Instead, prices tripled to $145 a barrel by 2008 as demand quietly outpaced expectations. The same ingredients are here again: overestimated supply, underestimated demand, and extreme pessimism.
- 2002
the IEA also forecast a major oil surplus
- By 2008
prices tripled to $145 a barrel
Meanwhile, inflation quietly tilts the playing field in energy’s favor. Across the past five decades, whenever inflation averaged above 3% and was rising, energy delivered the best inflation-adjusted returns of any sector. With 26 central banks cutting rates and reflation policies accelerating globally, we’re entering the part of the cycle where energy historically shines.
Gold, copper, and aluminum have already surged to multi-year highs. Energy has lagged badly—a divergence that rarely lasts.
When oil normalizes from $60 to $90, energy equities don’t move in percentages; they move in multiples. Energy stocks now trade at the lowest P/E ratios in the S&P 500, ranking in the bottom 20% of their 30-year valuation range.
After years of capital discipline, companies are returning more cash to shareholders than they’re spending on growth. ETF flows have dried up. Sector weightings have collapsed.
At Flextion, we look for inflection points where fundamentals, valuation, and sentiment align to create asymmetric opportunities. Energy checks every box:
Energy may not be the trade everyone’s talking about but it could be the one everyone wishes they had made.
Based on Flextion’s analysis, here are six ETFs we find attractive, including a blend of value and smaller capitalization exposure.
This is what a bottom looks like—not when things are bad, but when nobody cares.
From the Flextion archive. Views are the author’s as of December 1, 2025 and are not investment advice.